
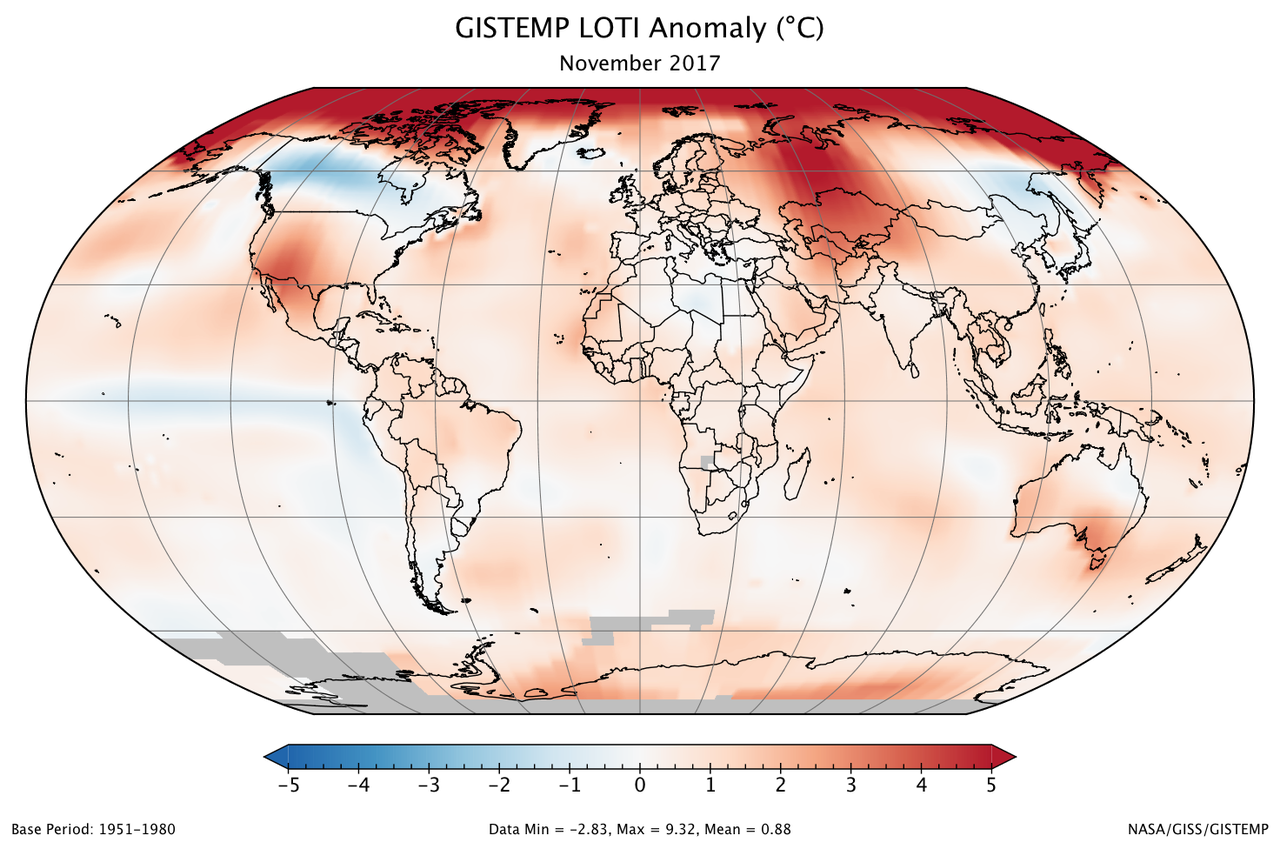
A global map of the November 2017 LOTI (land-ocean temperature index) anomaly, relative to the 1951-1980 November average. Part of Antarctica is gray because data from some stations there were not yet available at the time of this posting. View larger image.
2666_A2D66D9D-B5DB-4BE4-B030-D1F3911CBF6D

Be the first to comment